* Tracing busy processes/threads freezes/stalls the whole machine
@ 2021-04-22 14:26 Stefan Metzmacher
2021-04-22 14:55 ` Stefan Metzmacher
` (2 more replies)
0 siblings, 3 replies; 17+ messages in thread
From: Stefan Metzmacher @ 2021-04-22 14:26 UTC (permalink / raw)
To: Steven Rostedt, Ingo Molnar; +Cc: linux-trace-devel, io-uring
Hi Steven, hi Ingo,
I recently tried to analyze the performance of Samba using io-uring.
I was using ubuntu 20.04 with the 5.10.0-1023-oem kernel, which is based on v5.10.25, see:
https://kernel.ubuntu.com/git/kernel-ppa/mirror/ubuntu-oem-5.10-focal.git/log/?h=oem-5.10-prep
trace-cmd is at version 2.8.3-4build1.
In order to find the bottleneck I tried to use (trace-cmd is at version 2.8.3-4build1):
trace-cmd -e all -P ${pid_of_io_uring_worker}
As a result the server was completely dead immediately.
I tried to reproduce this in a virtual machine (inside virtualbox).
I used a modified 'io_uring-cp' that loops forever, see:
https://github.com/metze-samba/liburing/commit/5e98efed053baf03521692e786c1c55690b04d8e
When I run './io_uring-cp-forever link-cp.c file',
I see a 'io_wq_manager' and a 'io_wqe_worker-0' kernel thread,
while './io_uring-cp-forever link-cp.c file' as well as 'io_wqe_worker-0'
consume about 25% cpu each.
When I run 'trace-cmd -e all -P $pid' for 'io_wqe_worker-0' or 'io_wq_manager'
I can reproduce the problem, then I found that the same seems to happen for
also for other kernel threads e.g. '[kworker/1:1-events]', it seems that
it happens for all kernel threads, which are not completely idle.
Which this:
From 'top':
1341 root 20 0 2512 576 508 S 33,4 0,1 0:10.39 io_uring-cp-for
1343 root 20 0 0 0 0 R 29,8 0,0 0:08.43 io_wqe_worker-0
7 root 20 0 0 0 0 I 0,3 0,0 0:00.31 kworker/0:1-events
PID 5 is [kworker/0:0-ata_sff]
# trace-cmd record -e all -P 5'
Hit Ctrl^C to stop recording
^CCPU0 data recorded at offset=0x7b8000
0 bytes in size
CPU1 data recorded at offset=0x7b8000
69632 bytes in size
# But
# trace-cmd record -e all -P 7
=> machine unresponsive (no blinking cursor on the console anymore)
On the host 'top' shows that the VirtualBoxVM cpu emulator thread 'EMT-1'
uses 100% cpu, so I guess the guest kernel is in something like an endless
recursion loop. Maybe a trace function recursing to itself?
On the same VM I tried a 5.12rc8 kernel and there I can also reproduce the
problem.
I also managed to reproduce the problem without io-uring, just using:
while true; do cat linux-image-5.12.0-rc8-dbg_5.12.0-rc8-22_amd64.deb > /dev/null; done
in order to keep some kernel threads moving.
This happens with 5.12rc8 and 5.10.0-1023-oem, but I was not able to
reproduce any of this using the 5.8.0-50-generic kernel, see
https://kernel.ubuntu.com/git/ubuntu/ubuntu-focal.git/log/?h=Ubuntu-hwe-5.8-5.8.0-50.56_20.04.1
I was also able to reproduce this with a ubuntu 21.04 vm using
the 5.11.0-14-generic kernel, see:
https://kernel.ubuntu.com/git/ubuntu/ubuntu-hirsute.git/log/?h=Ubuntu-5.11.0-14.15
On this one I only managed to reproduce the problem with
'./io_uring-cp-forever link-cp.c file', but not with
'while true; do cat linux-image-5.12.0-rc8-dbg_5.12.0-rc8-22_amd64.deb > /dev/null; done'
So it seems the problem was introduced after 5.8 and is not really related to
io-uring. And it may not be purely related to kernel threads.
With this on 5.12-rc8 (again):
└─tmux: server,903
├─bash,904
│ └─io_uring-cp-for,925 link-cp.c file
│ ├─{iou-mgr-925},926
│ └─{iou-wrk-925},927
└─bash,929
└─pstree,938 -a -t -p
I was able to to trace once:
root@ub1704-166:~# trace-cmd record -e all -P 925
Hit Ctrl^C to stop recording
^CCPU0 data recorded at offset=0x7b8000
10842112 bytes in size
CPU1 data recorded at offset=0x120f000
36450304 bytes in size
But the 2nd run reproduced the problem:
root@ub1704-166:~# trace-cmd record -e all -P 925
I was also able to reproduce it with:
while true; do cat linux-image-5.12.0-rc8-dbg_5.12.0-rc8-22_amd64.deb > /dev/null; done
and
pidofcat=$(pidof cat); echo $pidofcat; trace-cmd record -e all -P $pidofcat
So it seems any busy thread (user or kernel) triggers the problem.
Any ideas what has changed after 5.8?
Thanks!
metze
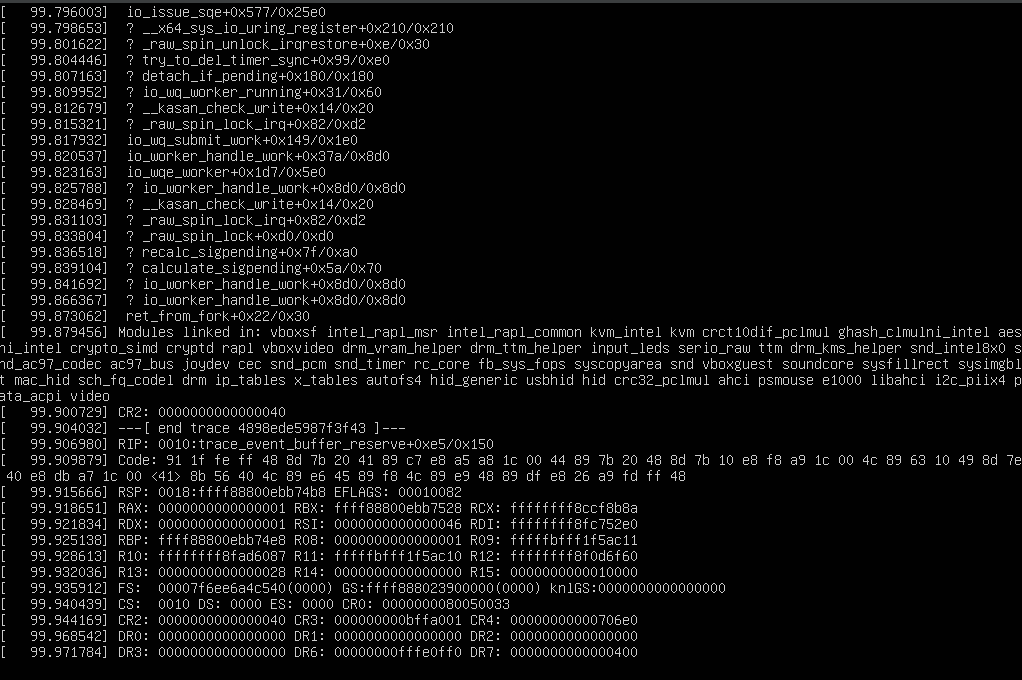
^ permalink raw reply [flat|nested] 17+ messages in thread* Re: Tracing busy processes/threads freezes/stalls the whole machine 2021-04-22 14:26 Tracing busy processes/threads freezes/stalls the whole machine Stefan Metzmacher @ 2021-04-22 14:55 ` Stefan Metzmacher 2021-05-04 12:26 ` Stefan Metzmacher 2021-05-04 13:24 ` Steven Rostedt 2 siblings, 0 replies; 17+ messages in thread From: Stefan Metzmacher @ 2021-04-22 14:55 UTC (permalink / raw) To: Jens Axboe; +Cc: linux-trace-devel, io-uring, Steven Rostedt, Ingo Molnar Hi Jens, maybe not strictly related, but maybe it is... > I recently tried to analyze the performance of Samba using io-uring. > > I was using ubuntu 20.04 with the 5.10.0-1023-oem kernel, which is based on v5.10.25, see: > https://kernel.ubuntu.com/git/kernel-ppa/mirror/ubuntu-oem-5.10-focal.git/log/?h=oem-5.10-prep > trace-cmd is at version 2.8.3-4build1. > > In order to find the bottleneck I tried to use (trace-cmd is at version 2.8.3-4build1): > > trace-cmd -e all -P ${pid_of_io_uring_worker} > > As a result the server was completely dead immediately. > > I tried to reproduce this in a virtual machine (inside virtualbox). > > I used a modified 'io_uring-cp' that loops forever, see: > https://github.com/metze-samba/liburing/commit/5e98efed053baf03521692e786c1c55690b04d8e > > When I run './io_uring-cp-forever link-cp.c file', > I see a 'io_wq_manager' and a 'io_wqe_worker-0' kernel thread, > while './io_uring-cp-forever link-cp.c file' as well as 'io_wqe_worker-0' > consume about 25% cpu each. While doing the tests with 5.12-rc8, I somehow triggered a backtrace on the VM console: it contains: ... io_issue_seq... ... io_wq_submit_work io_worker_handle_work io_wqe_worker ... io_worker_handle_work ... RIP: 0100:trace_event_buffer_reserve+0xe5/0x150 Here's a screenshot of it:https://www.samba.org/~metze/io_issue_sqe_trace_event_buffer_reserve-5.12-rc8-backtrace.png I don't know what the last action was, that I did before it happened. metze ^ permalink raw reply [flat|nested] 17+ messages in thread
* Re: Tracing busy processes/threads freezes/stalls the whole machine
  2021-04-22 14:26 Tracing busy processes/threads freezes/stalls the whole machine Stefan Metzmacher
  2021-04-22 14:55 ` Stefan Metzmacher
@ 2021-05-04 12:26 ` Stefan Metzmacher
  2021-05-04 13:24 ` Steven Rostedt
  2 siblings, 0 replies; 17+ messages in thread
From: Stefan Metzmacher @ 2021-05-04 12:26 UTC (permalink / raw)
  To: Steven Rostedt, Ingo Molnar; +Cc: linux-trace-devel, io-uring, linux-kernel

+ linux-kernel

I just retested with 5.12 final:

As long as I give the VM more than one cpu, I can easily reproduce the problem with:

> while true; do cat linux-image-5.12.0-rc8-dbg_5.12.0-rc8-22_amd64.deb > /dev/null; done
> and
> pidofcat=$(pidof cat); echo $pidofcat; trace-cmd record -e all -P $pidofcat

On a single cpu VM it doesn't seem to trigger.

Is anyone else able to reproduce this?

Any ideas how to debug this?

It's really annoying to fear a machine freeze when trying to trace problems
on recent kernels...

Thanks for any possible hint...
metze

Am 22.04.21 um 16:26 schrieb Stefan Metzmacher:
>
> Hi Steven, hi Ingo,
>
> I recently tried to analyze the performance of Samba using io-uring.
>
> I was using ubuntu 20.04 with the 5.10.0-1023-oem kernel, which is based on v5.10.25, see:
> https://kernel.ubuntu.com/git/kernel-ppa/mirror/ubuntu-oem-5.10-focal.git/log/?h=oem-5.10-prep
> trace-cmd is at version 2.8.3-4build1.
>
> In order to find the bottleneck I tried to use (trace-cmd is at version 2.8.3-4build1):
>
>   trace-cmd -e all -P ${pid_of_io_uring_worker}
>
> As a result the server was completely dead immediately.
>
> I tried to reproduce this in a virtual machine (inside virtualbox).
>
> I used a modified 'io_uring-cp' that loops forever, see:
> https://github.com/metze-samba/liburing/commit/5e98efed053baf03521692e786c1c55690b04d8e
>
> When I run './io_uring-cp-forever link-cp.c file',
> I see a 'io_wq_manager' and a 'io_wqe_worker-0' kernel thread,
> while './io_uring-cp-forever link-cp.c file' as well as 'io_wqe_worker-0'
> consume about 25% cpu each.
>
> When I run 'trace-cmd -e all -P $pid' for 'io_wqe_worker-0' or 'io_wq_manager'
> I can reproduce the problem, then I found that the same seems to happen for
> also for other kernel threads e.g. '[kworker/1:1-events]', it seems that
> it happens for all kernel threads, which are not completely idle.
>
> Which this:
>
>  From 'top':
>    1341 root      20   0    2512    576    508 S  33,4   0,1   0:10.39 io_uring-cp-for
>    1343 root      20   0       0      0      0 R  29,8   0,0   0:08.43 io_wqe_worker-0
>       7 root      20   0       0      0      0 I   0,3   0,0   0:00.31 kworker/0:1-events
>
>    PID 5 is [kworker/0:0-ata_sff]
>
> # trace-cmd record -e all -P 5'
> Hit Ctrl^C to stop recording
> ^CCPU0 data recorded at offset=0x7b8000
>     0 bytes in size
> CPU1 data recorded at offset=0x7b8000
>     69632 bytes in size
>
> # But
> # trace-cmd record -e all -P 7
> => machine unresponsive (no blinking cursor on the console anymore)
> On the host 'top' shows that the VirtualBoxVM cpu emulator thread 'EMT-1'
> uses 100% cpu, so I guess the guest kernel is in something like an endless
> recursion loop. Maybe a trace function recursing to itself?
>
> On the same VM I tried a 5.12rc8 kernel and there I can also reproduce the
> problem.
>
> I also managed to reproduce the problem without io-uring, just using:
>
>  while true; do cat linux-image-5.12.0-rc8-dbg_5.12.0-rc8-22_amd64.deb > /dev/null; done
>
> in order to keep some kernel threads moving.
> This happens with 5.12rc8 and 5.10.0-1023-oem, but I was not able to
> reproduce any of this using the 5.8.0-50-generic kernel, see
> https://kernel.ubuntu.com/git/ubuntu/ubuntu-focal.git/log/?h=Ubuntu-hwe-5.8-5.8.0-50.56_20.04.1
>
> I was also able to reproduce this with a ubuntu 21.04 vm using
> the 5.11.0-14-generic kernel, see:
> https://kernel.ubuntu.com/git/ubuntu/ubuntu-hirsute.git/log/?h=Ubuntu-5.11.0-14.15
> On this one I only managed to reproduce the problem with
> './io_uring-cp-forever link-cp.c file', but not with
> 'while true; do cat linux-image-5.12.0-rc8-dbg_5.12.0-rc8-22_amd64.deb > /dev/null; done'
>
>
> So it seems the problem was introduced after 5.8 and is not really related to
> io-uring. And it may not be purely related to kernel threads.
>
> With this on 5.12-rc8 (again):
>
>   └─tmux: server,903
>       ├─bash,904
>       │   └─io_uring-cp-for,925 link-cp.c file
>       │       ├─{iou-mgr-925},926
>       │       └─{iou-wrk-925},927
>       └─bash,929
>           └─pstree,938 -a -t -p
>
> I was able to to trace once:
>
> root@ub1704-166:~# trace-cmd record -e all -P 925
> Hit Ctrl^C to stop recording
> ^CCPU0 data recorded at offset=0x7b8000
>     10842112 bytes in size
> CPU1 data recorded at offset=0x120f000
>     36450304 bytes in size
>
> But the 2nd run reproduced the problem:
> root@ub1704-166:~# trace-cmd record -e all -P 925
>
> I was also able to reproduce it with:
>
> while true; do cat linux-image-5.12.0-rc8-dbg_5.12.0-rc8-22_amd64.deb > /dev/null; done
> and
> pidofcat=$(pidof cat); echo $pidofcat; trace-cmd record -e all -P $pidofcat
>
> So it seems any busy thread (user or kernel) triggers the problem.
>
> Any ideas what has changed after 5.8?
>
> Thanks!
> metze
>


^ permalink raw reply	[flat|nested] 17+ messages in thread
* Re: Tracing busy processes/threads freezes/stalls the whole machine
  2021-04-22 14:26 Tracing busy processes/threads freezes/stalls the whole machine Stefan Metzmacher
  2021-04-22 14:55 ` Stefan Metzmacher
  2021-05-04 12:26 ` Stefan Metzmacher
@ 2021-05-04 13:24 ` Steven Rostedt
  2021-05-04 13:28   ` Stefan Metzmacher
  2 siblings, 1 reply; 17+ messages in thread
From: Steven Rostedt @ 2021-05-04 13:24 UTC (permalink / raw)
  To: Stefan Metzmacher; +Cc: Ingo Molnar, linux-trace-devel, io-uring

On Thu, 22 Apr 2021 16:26:57 +0200
Stefan Metzmacher <metze@samba.org> wrote:

> Hi Steven, hi Ingo,
>

Sorry, somehow I missed this.

> # But
> # trace-cmd record -e all -P 7

I'm curious.

What is the clock set to? What does:

 # trace-cmd list -C

show?

-- Steve

^ permalink raw reply	[flat|nested] 17+ messages in thread
* Re: Tracing busy processes/threads freezes/stalls the whole machine
  2021-05-04 13:24 ` Steven Rostedt
@ 2021-05-04 13:28   ` Stefan Metzmacher
  2021-05-04 13:32     ` Steven Rostedt
  2021-05-04 13:35     ` Steven Rostedt
  0 siblings, 2 replies; 17+ messages in thread
From: Stefan Metzmacher @ 2021-05-04 13:28 UTC (permalink / raw)
  To: Steven Rostedt; +Cc: Ingo Molnar, linux-trace-devel, io-uring


Am 04.05.21 um 15:24 schrieb Steven Rostedt:
> On Thu, 22 Apr 2021 16:26:57 +0200
> Stefan Metzmacher <metze@samba.org> wrote:
>
>> Hi Steven, hi Ingo,
>>
>
> Sorry, somehow I missed this.
>
>> # But
>> # trace-cmd record -e all -P 7
>
> I'm curious.
>
> What is the clock set to? What does:
>
>  # trace-cmd list -C
>
> show?

On both machine (physical and VM):
trace-cmd list -C
[local] global counter uptime perf mono mono_raw boot x86-tsc

Thanks for looking at it!
metze

^ permalink raw reply	[flat|nested] 17+ messages in thread
* Re: Tracing busy processes/threads freezes/stalls the whole machine
  2021-05-04 13:28   ` Stefan Metzmacher
@ 2021-05-04 13:32     ` Steven Rostedt
  2021-05-04 13:35     ` Steven Rostedt
  1 sibling, 0 replies; 17+ messages in thread
From: Steven Rostedt @ 2021-05-04 13:32 UTC (permalink / raw)
  To: Stefan Metzmacher; +Cc: Ingo Molnar, linux-trace-devel, io-uring

On Tue, 4 May 2021 15:28:12 +0200
Stefan Metzmacher <metze@samba.org> wrote:

> Am 04.05.21 um 15:24 schrieb Steven Rostedt:
> > On Thu, 22 Apr 2021 16:26:57 +0200
> > Stefan Metzmacher <metze@samba.org> wrote:
> >
> >> Hi Steven, hi Ingo,
> >>
> >
> > Sorry, somehow I missed this.
> >
> >> # But
> >> # trace-cmd record -e all -P 7
> >
> > I'm curious.
> >
> > What is the clock set to? What does:
> >
> >  # trace-cmd list -C
> >
> > show?
>
> On both machine (physical and VM):
> trace-cmd list -C
> [local] global counter uptime perf mono mono_raw boot x86-tsc
>
> Thanks for looking at it!

Bah, I was hoping it would show "[global]" as we just discovered a bug
because the global clock took a spin lock and a recent change allowed it to
recurse once (causing a deadlock if it happened). But the "[local]" clock
has no such issue. Which means I need to do a bit more digging into this
cause :-(

-- Steve


^ permalink raw reply	[flat|nested] 17+ messages in thread
* Re: Tracing busy processes/threads freezes/stalls the whole machine
  2021-05-04 13:28   ` Stefan Metzmacher
  2021-05-04 13:32     ` Steven Rostedt
@ 2021-05-04 13:35     ` Steven Rostedt
  2021-05-05  9:50       ` Stefan Metzmacher
  1 sibling, 1 reply; 17+ messages in thread
From: Steven Rostedt @ 2021-05-04 13:35 UTC (permalink / raw)
  To: Stefan Metzmacher; +Cc: Ingo Molnar, linux-trace-devel, io-uring

On Tue, 4 May 2021 15:28:12 +0200
Stefan Metzmacher <metze@samba.org> wrote:

> Am 04.05.21 um 15:24 schrieb Steven Rostedt:
> > On Thu, 22 Apr 2021 16:26:57 +0200
> > Stefan Metzmacher <metze@samba.org> wrote:
> >
> >> Hi Steven, hi Ingo,
> >>
> >
> > Sorry, somehow I missed this.
> >
> >> # But
> >> # trace-cmd record -e all -P 7

Perhaps you could try something like this:

 # trace-cmd list -s |
    while read e ; do
      echo "testing $e";
      trace-cmd record -P 7 -e $e sleep 1;
    done

Which will enable each system at a time, and see if we can pin point what
is causing the lock up. Narrow it down to a tracing system.

-- Steve

^ permalink raw reply	[flat|nested] 17+ messages in thread
* Re: Tracing busy processes/threads freezes/stalls the whole machine
  2021-05-04 13:35     ` Steven Rostedt
@ 2021-05-05  9:50       ` Stefan Metzmacher
  2021-05-31 15:39         ` Stefan Metzmacher
  0 siblings, 1 reply; 17+ messages in thread
From: Stefan Metzmacher @ 2021-05-05  9:50 UTC (permalink / raw)
  To: Steven Rostedt; +Cc: Ingo Molnar, linux-trace-devel, io-uring


Am 04.05.21 um 15:35 schrieb Steven Rostedt:
> On Tue, 4 May 2021 15:28:12 +0200
> Stefan Metzmacher <metze@samba.org> wrote:
>
>> Am 04.05.21 um 15:24 schrieb Steven Rostedt:
>>> On Thu, 22 Apr 2021 16:26:57 +0200
>>> Stefan Metzmacher <metze@samba.org> wrote:
>>>
>>>> Hi Steven, hi Ingo,
>>>>
>>>
>>> Sorry, somehow I missed this.
>>>
>>>> # But
>>>> # trace-cmd record -e all -P 7
>
> Perhaps you could try something like this:
>
>  # trace-cmd list -s |
>     while read e ; do
>       echo "testing $e";
>       trace-cmd record -P 7 -e $e sleep 1;
>     done
>
> Which will enable each system at a time, and see if we can pin point what
> is causing the lock up. Narrow it down to a tracing system.

I wasn't able to reproduce it.

With a 5.12 kernel and ubuntu 20.04 amd64 userspace I was able
to produce the following strace output (in the 2nd try), like this:

# ssh root@172.31.9.166 strace -f -ttT trace-cmd record -e all -P 101 2>&1 | tee out

101 is the pid of a kthread while my './io-uring_cp-forever link-cp.c file' runs
on '172.31.9.166'. See https://github.com/metze-samba/liburing/commits/io_uring-cp-forever
pid 1375 is the pid of 'iou-wrk-1373'.

Maybe it's related to writing the pid into /sys/kernel/tracing/set_event_pid
as it ends like this:
> 10:56:07.493869 stat("/sys/kernel/tracing/set_event_pid", {st_mode=S_IFREG|0644, st_size=0, ...}) = 0 <0.000222>
> 10:56:07.494500 openat(AT_FDCWD, "/sys/kernel/tracing/set_event_pid", O_RDONLY) = 3 <0.000134>
> 10:56:07.494934 read(3, "1375\n", 8192) = 5 <0.000433>
> 10:56:07.495708 close(3)                = 0 <0.000121>
...> [pid  1443] 10:56:10.045293 openat(AT_FDCWD, "/sys/kernel/tracing/set_ftrace_pid", O_WRONLY|O_TRUNC|O_CLOEXEC <unfinished ...>
> [pid  1444] 10:56:10.045650 <... read resumed>"sysfs /sys sysfs rw,nosuid,nodev"..., 1024) = 1024 <0.000948>
> [pid  1443] 10:56:10.045821 <... openat resumed>) = 5 <0.000359>
> [pid  1445] 10:56:10.046000 <... fstat resumed>{st_mode=S_IFREG|0444, st_size=0, ...}) = 0 <0.000873>
> [pid  1443] 10:56:10.046174 write(5, "101 ", 4 <unfinished ...>
> [pid  1444] 10:56:10.046674 read(5,  <unfinished ...>
> [pid  1443] 10:56:10.047007 <... write resumed>) = 4 <0.000475>
> [pid  1445] 10:56:10.047188 read(5,  <unfinished ...>
> [pid  1443] 10:56:10.047498 write(5, " ", 1 <unfinished ...>
> [pid  1444] 10:56:10.048343 <... read resumed>"_cls,net_prio cgroup rw,nosuid,n"..., 1024) = 1024 <0.001312>
> [pid  1445] 10:56:10.048578 <... read resumed>"sysfs /sys sysfs rw,nosuid,nodev"..., 1024) = 1024 <0.001224>
> [pid  1444] 10:56:10.048796 read(5,  <unfinished ...>
> [pid  1445] 10:56:10.049195 read(5,  <unfinished ...>
> [pid  1444] 10:56:10.049547 <... read resumed>"ges hugetlbfs rw,relatime,pagesi"..., 1024) = 690 <0.000403>
> [pid  1445] 10:56:10.049722 <... read resumed>"_cls,net_prio cgroup rw,nosuid,n"..., 1024) = 1024 <0.000339>
> [pid  1444] 10:56:10.049924 close(5 <unfinished ...>
> [pid  1445] 10:56:10.050224 read(5,  <unfinished ...>
> [pid  1444] 10:56:10.050550 <... close resumed>) = 0 <0.000323>
> [pid  1445] 10:56:10.050714 <... read resumed>"ges hugetlbfs rw,relatime,pagesi"..., 1024) = 690 <0.000327>
> [pid  1444] 10:56:10.050883 openat(AT_FDCWD, "trace.dat.cpu0", O_WRONLY|O_CREAT|O_TRUNC, 0644 <unfinished ...>
> [pid  1445] 10:56:10.051299 close(5)    = 0 <0.016204>
> [pid  1445] 10:56:10.067841 openat(AT_FDCWD, "trace.dat.cpu1", O_WRONLY|O_CREAT|O_TRUNC, 0644 <unfinished ...>
> [pid  1443] 10:56:10.100729 <... write resumed>) = 0 <0.052057>
> [pid  1443] 10:56:10.101022 openat(AT_FDCWD, "/sys/kernel/tracing/set_event_pid", O_WRONLY|O_TRUNC|O_CLOEXEC) = 6 <0.014801>
> [pid  1443] 10:56:10.116299 write(6, "101 ", 4

The full output can be found here:
https://www.samba.org/~metze/strace.5.12-trace-cmd-record-all-P-101-kthread-fail-01.txt

I redid it on ubuntu 21.04 with this kernel:
https://kernel.ubuntu.com/git/ubuntu/ubuntu-hirsute.git/tag/?h=Ubuntu-5.11.0-16.17
which is based on Linux 5.11.12

I tried it onces using of pid from a kthread and it didn't reproduce:
> 09:10:50.719423 openat(AT_FDCWD, "/sys/kernel/tracing/set_event_pid", O_RDONLY) = 3 <0.000084>
> 09:10:50.719605 read(3, "", 8192)       = 0 <0.000075>
> 09:10:50.719774 close(3)                = 0 <0.000080>
...
> [pid  1135] 09:10:53.468541 fcntl(6, F_GETPIPE_SZ) = 65536 <0.000009>
> [pid  1135] 09:10:53.468589 splice(5, NULL, 7, NULL, 4096, SPLICE_F_MOVE <unfinished ...>
> [pid  1134] 09:10:53.480165 <... write resumed>) = 0 <0.014106>
> [pid  1134] 09:10:53.480201 close(4)    = 0 <0.000011>
> [pid  1134] 09:10:53.480250 openat(AT_FDCWD, "/sys/kernel/tracing/set_event_pid", O_WRONLY|O_TRUNC|O_CLOEXEC) = 4 <0.000024>
> [pid  1134] 09:10:53.480311 write(4, "7 ", 2) = 2 <0.000194>
> [pid  1134] 09:10:53.480530 close(4)    = 0 <0.000011>
> [pid  1134] 09:10:53.480565 openat(AT_FDCWD, "/sys/kernel/tracing/tracing_enabled", O_WRONLY|O_CLOEXEC) = -1 ENOENT (No such file or directory) <0.000013>
> [pid  1134] 09:10:53.480605 write(3, "1", 1) = 1 <0.000008>
> [pid  1134] 09:10:53.480632 newfstatat(1, "", {st_mode=S_IFIFO|0600, st_size=0, ...}, AT_EMPTY_PATH) = 0 <0.000007>
> [pid  1134] 09:10:53.480673 pidfd_open(7, 0) = 4 <0.000010>
> [pid  1134] 09:10:53.480701 poll([{fd=4, events=POLLIN}], 1, -1

The full output can be found here:
https://www.samba.org/~metze/strace.5.11.12-trace-cmd-record-all-P-7-kthread-nofail-02.txt

And using the pid of io_wqe_worker-0 it happened again,
also writing the pid into /sys/kernel/tracing/set_event_pid:
(remember 7 was the pid of the kthread):
> 09:13:18.000315 openat(AT_FDCWD, "/sys/kernel/tracing/set_event_pid", O_RDONLY) = 3 <0.000074>
> 09:13:18.000471 read(3, "7\n", 8192)    = 2 <0.000158>
> 09:13:18.000703 close(3)                = 0 <0.000052>
...> [pid  1224] 09:13:20.671939 close(4)    = 0 <0.000084>
> [pid  1224] 09:13:20.672106 openat(AT_FDCWD, "trace.dat.cpu0", O_WRONLY|O_CREAT|O_TRUNC, 0644) = 4 <0.000085>
> [pid  1224] 09:13:20.672292 openat(AT_FDCWD, "/sys/kernel/tracing/per_cpu/cpu0/trace_pipe_raw", O_RDONLY) = 5 <0.000062>
> [pid  1224] 09:13:20.672432 pipe([6, 7]) = 0 <0.000057>
> [pid  1224] 09:13:20.672595 fcntl(6, F_GETPIPE_SZ) = 65536 <0.000051>
> [pid  1224] 09:13:20.672728 splice(5, NULL, 7, NULL, 4096, SPLICE_F_MOVE <unfinished ...>
> [pid  1223] 09:13:20.688172 <... write resumed>) = 0 <0.020134>
> [pid  1223] 09:13:20.688215 close(4)    = 0 <0.000015>
> [pid  1223] 09:13:20.688276 openat(AT_FDCWD, "/sys/kernel/tracing/set_event_pid", O_WRONLY|O_TRUNC|O_CLOEXEC) = 4 <0.027854>
> [pid  1223] 09:13:20.716198 write(4, "1043 ", 5

The full output can be found here:
https://www.samba.org/~metze/strace.5.11.12-trace-cmd-record-all-P-1043-io_wqe_worker-fail-03.txt

I thought it happens always if there was already a value in /sys/kernel/tracing/set_event_pid...,
but the next time I started with pid 6 from a kthread and directly triggered it:

> 09:41:24.029860 openat(AT_FDCWD, "/sys/kernel/tracing/set_event_pid", O_RDONLY) = 3 <0.000048>
> 09:41:24.029982 read(3, "", 8192)       = 0 <0.000046>
> 09:41:24.030101 close(3)                = 0 <0.000045>
...
> [pid  1425] 09:41:26.212972 read(4, "sysfs /sys sysfs rw,nosuid,nodev"..., 1024) = 1024 <0.000077>
> [pid  1425] 09:41:26.213128 read(4, "group/rdma cgroup rw,nosuid,node"..., 1024) = 1024 <0.000075>
> [pid  1425] 09:41:26.213316 read(4, "ev/hugepages hugetlbfs rw,relati"..., 1024) = 1024 <0.000058>
> [pid  1425] 09:41:26.213459 close(4)    = 0 <0.000044>
> [pid  1425] 09:41:26.213584 openat(AT_FDCWD, "trace.dat.cpu0", O_WRONLY|O_CREAT|O_TRUNC, 0644) = 4 <0.000229>
> [pid  1425] 09:41:26.213895 openat(AT_FDCWD, "/sys/kernel/tracing/per_cpu/cpu0/trace_pipe_raw", O_RDONLY) = 5 <0.000055>
> [pid  1425] 09:41:26.214030 pipe([6, 7]) = 0 <0.000066>
> [pid  1425] 09:41:26.214188 fcntl(6, F_GETPIPE_SZ) = 65536 <0.000065>
> [pid  1425] 09:41:26.214332 splice(5, NULL, 7, NULL, 4096, SPLICE_F_MOVE

It ended here, but I think the rest ( close(4); openat("/sys/kernel/tracing/set_event_pid"); write("6 ")
was just eaten by the delayed output of the ssh session.

The full output can be found here:
https://www.samba.org/~metze/strace.5.11.12-trace-cmd-record-all-P-6-kthread-fail-04.txt

Does these details help already?

Thanks!
metze

^ permalink raw reply	[flat|nested] 17+ messages in thread
* Re: Tracing busy processes/threads freezes/stalls the whole machine
  2021-05-05  9:50       ` Stefan Metzmacher
@ 2021-05-31 15:39         ` Stefan Metzmacher
  2021-07-19 17:07           ` Stefan Metzmacher
  0 siblings, 1 reply; 17+ messages in thread
From: Stefan Metzmacher @ 2021-05-31 15:39 UTC (permalink / raw)
  To: Steven Rostedt; +Cc: Ingo Molnar, linux-trace-devel, io-uring

Hi Steve,

did these details help in any ways?

Thanks!

Am 05.05.21 um 11:50 schrieb Stefan Metzmacher:
...
>>
>> Perhaps you could try something like this:
>>
>>  # trace-cmd list -s |
>>     while read e ; do
>>       echo "testing $e";
>>       trace-cmd record -P 7 -e $e sleep 1;
>>     done
>>
>> Which will enable each system at a time, and see if we can pin point what
>> is causing the lock up. Narrow it down to a tracing system.
>
> I wasn't able to reproduce it.
>
> With a 5.12 kernel and ubuntu 20.04 amd64 userspace I was able
> to produce the following strace output (in the 2nd try), like this:
>
> # ssh root@172.31.9.166 strace -f -ttT trace-cmd record -e all -P 101 2>&1 | tee out
>
> 101 is the pid of a kthread while my './io-uring_cp-forever link-cp.c file' runs
> on '172.31.9.166'. See https://github.com/metze-samba/liburing/commits/io_uring-cp-forever
> pid 1375 is the pid of 'iou-wrk-1373'.
>
> Maybe it's related to writing the pid into /sys/kernel/tracing/set_event_pid
> as it ends like this:
>> 10:56:07.493869 stat("/sys/kernel/tracing/set_event_pid", {st_mode=S_IFREG|0644, st_size=0, ...}) = 0 <0.000222>
>> 10:56:07.494500 openat(AT_FDCWD, "/sys/kernel/tracing/set_event_pid", O_RDONLY) = 3 <0.000134>
>> 10:56:07.494934 read(3, "1375\n", 8192) = 5 <0.000433>
>> 10:56:07.495708 close(3)                = 0 <0.000121>
> ...> [pid  1443] 10:56:10.045293 openat(AT_FDCWD, "/sys/kernel/tracing/set_ftrace_pid", O_WRONLY|O_TRUNC|O_CLOEXEC <unfinished ...>
>> [pid  1444] 10:56:10.045650 <... read resumed>"sysfs /sys sysfs rw,nosuid,nodev"..., 1024) = 1024 <0.000948>
>> [pid  1443] 10:56:10.045821 <... openat resumed>) = 5 <0.000359>
>> [pid  1445] 10:56:10.046000 <... fstat resumed>{st_mode=S_IFREG|0444, st_size=0, ...}) = 0 <0.000873>
>> [pid  1443] 10:56:10.046174 write(5, "101 ", 4 <unfinished ...>
>> [pid  1444] 10:56:10.046674 read(5,  <unfinished ...>
>> [pid  1443] 10:56:10.047007 <... write resumed>) = 4 <0.000475>
>> [pid  1445] 10:56:10.047188 read(5,  <unfinished ...>
>> [pid  1443] 10:56:10.047498 write(5, " ", 1 <unfinished ...>
>> [pid  1444] 10:56:10.048343 <... read resumed>"_cls,net_prio cgroup rw,nosuid,n"..., 1024) = 1024 <0.001312>
>> [pid  1445] 10:56:10.048578 <... read resumed>"sysfs /sys sysfs rw,nosuid,nodev"..., 1024) = 1024 <0.001224>
>> [pid  1444] 10:56:10.048796 read(5,  <unfinished ...>
>> [pid  1445] 10:56:10.049195 read(5,  <unfinished ...>
>> [pid  1444] 10:56:10.049547 <... read resumed>"ges hugetlbfs rw,relatime,pagesi"..., 1024) = 690 <0.000403>
>> [pid  1445] 10:56:10.049722 <... read resumed>"_cls,net_prio cgroup rw,nosuid,n"..., 1024) = 1024 <0.000339>
>> [pid  1444] 10:56:10.049924 close(5 <unfinished ...>
>> [pid  1445] 10:56:10.050224 read(5,  <unfinished ...>
>> [pid  1444] 10:56:10.050550 <... close resumed>) = 0 <0.000323>
>> [pid  1445] 10:56:10.050714 <... read resumed>"ges hugetlbfs rw,relatime,pagesi"..., 1024) = 690 <0.000327>
>> [pid  1444] 10:56:10.050883 openat(AT_FDCWD, "trace.dat.cpu0", O_WRONLY|O_CREAT|O_TRUNC, 0644 <unfinished ...>
>> [pid  1445] 10:56:10.051299 close(5)    = 0 <0.016204>
>> [pid  1445] 10:56:10.067841 openat(AT_FDCWD, "trace.dat.cpu1", O_WRONLY|O_CREAT|O_TRUNC, 0644 <unfinished ...>
>> [pid  1443] 10:56:10.100729 <... write resumed>) = 0 <0.052057>
>> [pid  1443] 10:56:10.101022 openat(AT_FDCWD, "/sys/kernel/tracing/set_event_pid", O_WRONLY|O_TRUNC|O_CLOEXEC) = 6 <0.014801>
>> [pid  1443] 10:56:10.116299 write(6, "101 ", 4
>
> The full output can be found here:
> https://www.samba.org/~metze/strace.5.12-trace-cmd-record-all-P-101-kthread-fail-01.txt
>
> I redid it on ubuntu 21.04 with this kernel:
> https://kernel.ubuntu.com/git/ubuntu/ubuntu-hirsute.git/tag/?h=Ubuntu-5.11.0-16.17
> which is based on Linux 5.11.12
>
> I tried it onces using of pid from a kthread and it didn't reproduce:
>> 09:10:50.719423 openat(AT_FDCWD, "/sys/kernel/tracing/set_event_pid", O_RDONLY) = 3 <0.000084>
>> 09:10:50.719605 read(3, "", 8192)       = 0 <0.000075>
>> 09:10:50.719774 close(3)                = 0 <0.000080>
> ...
>> [pid  1135] 09:10:53.468541 fcntl(6, F_GETPIPE_SZ) = 65536 <0.000009>
>> [pid  1135] 09:10:53.468589 splice(5, NULL, 7, NULL, 4096, SPLICE_F_MOVE <unfinished ...>
>> [pid  1134] 09:10:53.480165 <... write resumed>) = 0 <0.014106>
>> [pid  1134] 09:10:53.480201 close(4)    = 0 <0.000011>
>> [pid  1134] 09:10:53.480250 openat(AT_FDCWD, "/sys/kernel/tracing/set_event_pid", O_WRONLY|O_TRUNC|O_CLOEXEC) = 4 <0.000024>
>> [pid  1134] 09:10:53.480311 write(4, "7 ", 2) = 2 <0.000194>
>> [pid  1134] 09:10:53.480530 close(4)    = 0 <0.000011>
>> [pid  1134] 09:10:53.480565 openat(AT_FDCWD, "/sys/kernel/tracing/tracing_enabled", O_WRONLY|O_CLOEXEC) = -1 ENOENT (No such file or directory) <0.000013>
>> [pid  1134] 09:10:53.480605 write(3, "1", 1) = 1 <0.000008>
>> [pid  1134] 09:10:53.480632 newfstatat(1, "", {st_mode=S_IFIFO|0600, st_size=0, ...}, AT_EMPTY_PATH) = 0 <0.000007>
>> [pid  1134] 09:10:53.480673 pidfd_open(7, 0) = 4 <0.000010>
>> [pid  1134] 09:10:53.480701 poll([{fd=4, events=POLLIN}], 1, -1
>
> The full output can be found here:
> https://www.samba.org/~metze/strace.5.11.12-trace-cmd-record-all-P-7-kthread-nofail-02.txt
>
> And using the pid of io_wqe_worker-0 it happened again,
> also writing the pid into /sys/kernel/tracing/set_event_pid:
> (remember 7 was the pid of the kthread):
>> 09:13:18.000315 openat(AT_FDCWD, "/sys/kernel/tracing/set_event_pid", O_RDONLY) = 3 <0.000074>
>> 09:13:18.000471 read(3, "7\n", 8192)    = 2 <0.000158>
>> 09:13:18.000703 close(3)                = 0 <0.000052>
> ...> [pid  1224] 09:13:20.671939 close(4)    = 0 <0.000084>
>> [pid  1224] 09:13:20.672106 openat(AT_FDCWD, "trace.dat.cpu0", O_WRONLY|O_CREAT|O_TRUNC, 0644) = 4 <0.000085>
>> [pid  1224] 09:13:20.672292 openat(AT_FDCWD, "/sys/kernel/tracing/per_cpu/cpu0/trace_pipe_raw", O_RDONLY) = 5 <0.000062>
>> [pid  1224] 09:13:20.672432 pipe([6, 7]) = 0 <0.000057>
>> [pid  1224] 09:13:20.672595 fcntl(6, F_GETPIPE_SZ) = 65536 <0.000051>
>> [pid  1224] 09:13:20.672728 splice(5, NULL, 7, NULL, 4096, SPLICE_F_MOVE <unfinished ...>
>> [pid  1223] 09:13:20.688172 <... write resumed>) = 0 <0.020134>
>> [pid  1223] 09:13:20.688215 close(4)    = 0 <0.000015>
>> [pid  1223] 09:13:20.688276 openat(AT_FDCWD, "/sys/kernel/tracing/set_event_pid", O_WRONLY|O_TRUNC|O_CLOEXEC) = 4 <0.027854>
>> [pid  1223] 09:13:20.716198 write(4, "1043 ", 5
>
> The full output can be found here:
> https://www.samba.org/~metze/strace.5.11.12-trace-cmd-record-all-P-1043-io_wqe_worker-fail-03.txt
>
> I thought it happens always if there was already a value in /sys/kernel/tracing/set_event_pid...,
> but the next time I started with pid 6 from a kthread and directly triggered it:
>
>> 09:41:24.029860 openat(AT_FDCWD, "/sys/kernel/tracing/set_event_pid", O_RDONLY) = 3 <0.000048>
>> 09:41:24.029982 read(3, "", 8192)       = 0 <0.000046>
>> 09:41:24.030101 close(3)                = 0 <0.000045>
> ...
>> [pid  1425] 09:41:26.212972 read(4, "sysfs /sys sysfs rw,nosuid,nodev"..., 1024) = 1024 <0.000077>
>> [pid  1425] 09:41:26.213128 read(4, "group/rdma cgroup rw,nosuid,node"..., 1024) = 1024 <0.000075>
>> [pid  1425] 09:41:26.213316 read(4, "ev/hugepages hugetlbfs rw,relati"..., 1024) = 1024 <0.000058>
>> [pid  1425] 09:41:26.213459 close(4)    = 0 <0.000044>
>> [pid  1425] 09:41:26.213584 openat(AT_FDCWD, "trace.dat.cpu0", O_WRONLY|O_CREAT|O_TRUNC, 0644) = 4 <0.000229>
>> [pid  1425] 09:41:26.213895 openat(AT_FDCWD, "/sys/kernel/tracing/per_cpu/cpu0/trace_pipe_raw", O_RDONLY) = 5 <0.000055>
>> [pid  1425] 09:41:26.214030 pipe([6, 7]) = 0 <0.000066>
>> [pid  1425] 09:41:26.214188 fcntl(6, F_GETPIPE_SZ) = 65536 <0.000065>
>> [pid  1425] 09:41:26.214332 splice(5, NULL, 7, NULL, 4096, SPLICE_F_MOVE
>
> It ended here, but I think the rest ( close(4); openat("/sys/kernel/tracing/set_event_pid"); write("6 ")
> was just eaten by the delayed output of the ssh session.
>
> The full output can be found here:
> https://www.samba.org/~metze/strace.5.11.12-trace-cmd-record-all-P-6-kthread-fail-04.txt
>
> Does these details help already?
>
> Thanks!
> metze
>


^ permalink raw reply	[flat|nested] 17+ messages in thread
* Re: Tracing busy processes/threads freezes/stalls the whole machine
  2021-05-31 15:39         ` Stefan Metzmacher
@ 2021-07-19 17:07           ` Stefan Metzmacher
  2021-07-22 22:43             ` sched_waking vs. set_event_pid crash (Re: Tracing busy processes/threads freezes/stalls the whole machine) Stefan Metzmacher
  0 siblings, 1 reply; 17+ messages in thread
From: Stefan Metzmacher @ 2021-07-19 17:07 UTC (permalink / raw)
  To: Steven Rostedt; +Cc: Ingo Molnar, linux-trace-devel, io-uring


[-- Attachment #1.1: Type: text/plain, Size: 8526 bytes --]

Hi Steve,
> did these details help in any ways?

Ping :-)

Any change you can reproduce the problem?
Any pointers how to debug this problem?

Thanks!
metze

> Thanks!
>
> Am 05.05.21 um 11:50 schrieb Stefan Metzmacher:
> ...
>>>
>>> Perhaps you could try something like this:
>>>
>>>  # trace-cmd list -s |
>>>     while read e ; do
>>>       echo "testing $e";
>>>       trace-cmd record -P 7 -e $e sleep 1;
>>>     done
>>>
>>> Which will enable each system at a time, and see if we can pin point what
>>> is causing the lock up. Narrow it down to a tracing system.
>>
>> I wasn't able to reproduce it.
>>
>> With a 5.12 kernel and ubuntu 20.04 amd64 userspace I was able
>> to produce the following strace output (in the 2nd try), like this:
>>
>> # ssh root@172.31.9.166 strace -f -ttT trace-cmd record -e all -P 101 2>&1 | tee out
>>
>> 101 is the pid of a kthread while my './io-uring_cp-forever link-cp.c file' runs
>> on '172.31.9.166'. See https://github.com/metze-samba/liburing/commits/io_uring-cp-forever
>> pid 1375 is the pid of 'iou-wrk-1373'.
>>
>> Maybe it's related to writing the pid into /sys/kernel/tracing/set_event_pid
>> as it ends like this:
>>> 10:56:07.493869 stat("/sys/kernel/tracing/set_event_pid", {st_mode=S_IFREG|0644, st_size=0, ...}) = 0 <0.000222>
>>> 10:56:07.494500 openat(AT_FDCWD, "/sys/kernel/tracing/set_event_pid", O_RDONLY) = 3 <0.000134>
>>> 10:56:07.494934 read(3, "1375\n", 8192) = 5 <0.000433>
>>> 10:56:07.495708 close(3)                = 0 <0.000121>
>> ...> [pid  1443] 10:56:10.045293 openat(AT_FDCWD, "/sys/kernel/tracing/set_ftrace_pid", O_WRONLY|O_TRUNC|O_CLOEXEC <unfinished ...>
>>> [pid  1444] 10:56:10.045650 <... read resumed>"sysfs /sys sysfs rw,nosuid,nodev"..., 1024) = 1024 <0.000948>
>>> [pid  1443] 10:56:10.045821 <... openat resumed>) = 5 <0.000359>
>>> [pid  1445] 10:56:10.046000 <... fstat resumed>{st_mode=S_IFREG|0444, st_size=0, ...}) = 0 <0.000873>
>>> [pid  1443] 10:56:10.046174 write(5, "101 ", 4 <unfinished ...>
>>> [pid  1444] 10:56:10.046674 read(5,  <unfinished ...>
>>> [pid  1443] 10:56:10.047007 <... write resumed>) = 4 <0.000475>
>>> [pid  1445] 10:56:10.047188 read(5,  <unfinished ...>
>>> [pid  1443] 10:56:10.047498 write(5, " ", 1 <unfinished ...>
>>> [pid  1444] 10:56:10.048343 <... read resumed>"_cls,net_prio cgroup rw,nosuid,n"..., 1024) = 1024 <0.001312>
>>> [pid  1445] 10:56:10.048578 <... read resumed>"sysfs /sys sysfs rw,nosuid,nodev"..., 1024) = 1024 <0.001224>
>>> [pid  1444] 10:56:10.048796 read(5,  <unfinished ...>
>>> [pid  1445] 10:56:10.049195 read(5,  <unfinished ...>
>>> [pid  1444] 10:56:10.049547 <... read resumed>"ges hugetlbfs rw,relatime,pagesi"..., 1024) = 690 <0.000403>
>>> [pid  1445] 10:56:10.049722 <... read resumed>"_cls,net_prio cgroup rw,nosuid,n"..., 1024) = 1024 <0.000339>
>>> [pid  1444] 10:56:10.049924 close(5 <unfinished ...>
>>> [pid  1445] 10:56:10.050224 read(5,  <unfinished ...>
>>> [pid  1444] 10:56:10.050550 <... close resumed>) = 0 <0.000323>
>>> [pid  1445] 10:56:10.050714 <... read resumed>"ges hugetlbfs rw,relatime,pagesi"..., 1024) = 690 <0.000327>
>>> [pid  1444] 10:56:10.050883 openat(AT_FDCWD, "trace.dat.cpu0", O_WRONLY|O_CREAT|O_TRUNC, 0644 <unfinished ...>
>>> [pid  1445] 10:56:10.051299 close(5)    = 0 <0.016204>
>>> [pid  1445] 10:56:10.067841 openat(AT_FDCWD, "trace.dat.cpu1", O_WRONLY|O_CREAT|O_TRUNC, 0644 <unfinished ...>
>>> [pid  1443] 10:56:10.100729 <... write resumed>) = 0 <0.052057>
>>> [pid  1443] 10:56:10.101022 openat(AT_FDCWD, "/sys/kernel/tracing/set_event_pid", O_WRONLY|O_TRUNC|O_CLOEXEC) = 6 <0.014801>
>>> [pid  1443] 10:56:10.116299 write(6, "101 ", 4
>>
>> The full output can be found here:
>> https://www.samba.org/~metze/strace.5.12-trace-cmd-record-all-P-101-kthread-fail-01.txt
>>
>> I redid it on ubuntu 21.04 with this kernel:
>> https://kernel.ubuntu.com/git/ubuntu/ubuntu-hirsute.git/tag/?h=Ubuntu-5.11.0-16.17
>> which is based on Linux 5.11.12
>>
>> I tried it onces using of pid from a kthread and it didn't reproduce:
>>> 09:10:50.719423 openat(AT_FDCWD, "/sys/kernel/tracing/set_event_pid", O_RDONLY) = 3 <0.000084>
>>> 09:10:50.719605 read(3, "", 8192)       = 0 <0.000075>
>>> 09:10:50.719774 close(3)                = 0 <0.000080>
>> ...
>>> [pid  1135] 09:10:53.468541 fcntl(6, F_GETPIPE_SZ) = 65536 <0.000009>
>>> [pid  1135] 09:10:53.468589 splice(5, NULL, 7, NULL, 4096, SPLICE_F_MOVE <unfinished ...>
>>> [pid  1134] 09:10:53.480165 <... write resumed>) = 0 <0.014106>
>>> [pid  1134] 09:10:53.480201 close(4)    = 0 <0.000011>
>>> [pid  1134] 09:10:53.480250 openat(AT_FDCWD, "/sys/kernel/tracing/set_event_pid", O_WRONLY|O_TRUNC|O_CLOEXEC) = 4 <0.000024>
>>> [pid  1134] 09:10:53.480311 write(4, "7 ", 2) = 2 <0.000194>
>>> [pid  1134] 09:10:53.480530 close(4)    = 0 <0.000011>
>>> [pid  1134] 09:10:53.480565 openat(AT_FDCWD, "/sys/kernel/tracing/tracing_enabled", O_WRONLY|O_CLOEXEC) = -1 ENOENT (No such file or directory) <0.000013>
>>> [pid  1134] 09:10:53.480605 write(3, "1", 1) = 1 <0.000008>
>>> [pid  1134] 09:10:53.480632 newfstatat(1, "", {st_mode=S_IFIFO|0600, st_size=0, ...}, AT_EMPTY_PATH) = 0 <0.000007>
>>> [pid  1134] 09:10:53.480673 pidfd_open(7, 0) = 4 <0.000010>
>>> [pid  1134] 09:10:53.480701 poll([{fd=4, events=POLLIN}], 1, -1
>>
>> The full output can be found here:
>> https://www.samba.org/~metze/strace.5.11.12-trace-cmd-record-all-P-7-kthread-nofail-02.txt
>>
>> And using the pid of io_wqe_worker-0 it happened again,
>> also writing the pid into /sys/kernel/tracing/set_event_pid:
>> (remember 7 was the pid of the kthread):
>>> 09:13:18.000315 openat(AT_FDCWD, "/sys/kernel/tracing/set_event_pid", O_RDONLY) = 3 <0.000074>
>>> 09:13:18.000471 read(3, "7\n", 8192)    = 2 <0.000158>
>>> 09:13:18.000703 close(3)                = 0 <0.000052>
>> ...> [pid  1224] 09:13:20.671939 close(4)    = 0 <0.000084>
>>> [pid  1224] 09:13:20.672106 openat(AT_FDCWD, "trace.dat.cpu0", O_WRONLY|O_CREAT|O_TRUNC, 0644) = 4 <0.000085>
>>> [pid  1224] 09:13:20.672292 openat(AT_FDCWD, "/sys/kernel/tracing/per_cpu/cpu0/trace_pipe_raw", O_RDONLY) = 5 <0.000062>
>>> [pid  1224] 09:13:20.672432 pipe([6, 7]) = 0 <0.000057>
>>> [pid  1224] 09:13:20.672595 fcntl(6, F_GETPIPE_SZ) = 65536 <0.000051>
>>> [pid  1224] 09:13:20.672728 splice(5, NULL, 7, NULL, 4096, SPLICE_F_MOVE <unfinished ...>
>>> [pid  1223] 09:13:20.688172 <... write resumed>) = 0 <0.020134>
>>> [pid  1223] 09:13:20.688215 close(4)    = 0 <0.000015>
>>> [pid  1223] 09:13:20.688276 openat(AT_FDCWD, "/sys/kernel/tracing/set_event_pid", O_WRONLY|O_TRUNC|O_CLOEXEC) = 4 <0.027854>
>>> [pid  1223] 09:13:20.716198 write(4, "1043 ", 5
>>
>> The full output can be found here:
>> https://www.samba.org/~metze/strace.5.11.12-trace-cmd-record-all-P-1043-io_wqe_worker-fail-03.txt
>>
>> I thought it happens always if there was already a value in /sys/kernel/tracing/set_event_pid...,
>> but the next time I started with pid 6 from a kthread and directly triggered it:
>>
>>> 09:41:24.029860 openat(AT_FDCWD, "/sys/kernel/tracing/set_event_pid", O_RDONLY) = 3 <0.000048>
>>> 09:41:24.029982 read(3, "", 8192)       = 0 <0.000046>
>>> 09:41:24.030101 close(3)                = 0 <0.000045>
>> ...
>>> [pid  1425] 09:41:26.212972 read(4, "sysfs /sys sysfs rw,nosuid,nodev"..., 1024) = 1024 <0.000077>
>>> [pid  1425] 09:41:26.213128 read(4, "group/rdma cgroup rw,nosuid,node"..., 1024) = 1024 <0.000075>
>>> [pid  1425] 09:41:26.213316 read(4, "ev/hugepages hugetlbfs rw,relati"..., 1024) = 1024 <0.000058>
>>> [pid  1425] 09:41:26.213459 close(4)    = 0 <0.000044>
>>> [pid  1425] 09:41:26.213584 openat(AT_FDCWD, "trace.dat.cpu0", O_WRONLY|O_CREAT|O_TRUNC, 0644) = 4 <0.000229>
>>> [pid  1425] 09:41:26.213895 openat(AT_FDCWD, "/sys/kernel/tracing/per_cpu/cpu0/trace_pipe_raw", O_RDONLY) = 5 <0.000055>
>>> [pid  1425] 09:41:26.214030 pipe([6, 7]) = 0 <0.000066>
>>> [pid  1425] 09:41:26.214188 fcntl(6, F_GETPIPE_SZ) = 65536 <0.000065>
>>> [pid  1425] 09:41:26.214332 splice(5, NULL, 7, NULL, 4096, SPLICE_F_MOVE
>>
>> It ended here, but I think the rest ( close(4); openat("/sys/kernel/tracing/set_event_pid"); write("6 ")
>> was just eaten by the delayed output of the ssh session.
>>
>> The full output can be found here:
>> https://www.samba.org/~metze/strace.5.11.12-trace-cmd-record-all-P-6-kthread-fail-04.txt
>>
>> Does these details help already?
>>
>> Thanks!
>> metze
>>
>


[-- Attachment #2: OpenPGP digital signature --]
[-- Type: application/pgp-signature, Size: 833 bytes --]

^ permalink raw reply	[flat|nested] 17+ messages in thread
* sched_waking vs. set_event_pid crash (Re: Tracing busy processes/threads freezes/stalls the whole machine)
  2021-07-19 17:07           ` Stefan Metzmacher
@ 2021-07-22 22:43             ` Stefan Metzmacher
  2021-07-23  1:41               ` Steven Rostedt
  2021-07-23  2:51               ` Steven Rostedt
  0 siblings, 2 replies; 17+ messages in thread
From: Stefan Metzmacher @ 2021-07-22 22:43 UTC (permalink / raw)
  To: Steven Rostedt; +Cc: Ingo Molnar, linux-trace-devel, io-uring, linux-kernel


[-- Attachment #1.1: Type: text/plain, Size: 8084 bytes --]


Hi Steve,

After some days of training:
https://training.linuxfoundation.org/training/linux-kernel-debugging-and-security/
I was able to get much closer to the problem :-)

In order to reproduce it and get reliable kexec crash dumps,
I needed to give the VM at least 3 cores.

While running './io-uring_cp-forever link-cp.c file' (from:
https://github.com/metze-samba/liburing/commits/io_uring-cp-forever )
in one window, the following simple sequence triggered the problem in most cases:

echo 1 > /sys/kernel/tracing/events/sched/sched_waking/enable
echo 1 > /sys/kernel/tracing/set_event_pid

It triggered the following:

> [  192.924023] ------------[ cut here ]------------
> [  192.924026] WARNING: CPU: 2 PID: 1696 at arch/x86/include/asm/kfence.h:44 kfence_protect_page+0x33/0xc0
> [  192.924034] Modules linked in: vboxsf intel_rapl_msr intel_rapl_common crct10dif_pclmul ghash_clmulni_intel aesni_intel crypto_simd cryptd rapl vboxvideo drm_vr
> am_helper drm_ttm_helper ttm snd_intel8x0 input_leds snd_ac97_codec joydev ac97_bus serio_raw snd_pcm drm_kms_helper cec mac_hid vboxguest snd_timer rc_core snd fb
> _sys_fops syscopyarea sysfillrect soundcore sysimgblt kvm_intel kvm sch_fq_codel drm sunrpc ip_tables x_tables autofs4 hid_generic usbhid hid crc32_pclmul psmouse
> ahci libahci e1000 i2c_piix4 pata_acpi video
> [  192.924068] CPU: 2 PID: 1696 Comm: io_uring-cp-for Kdump: loaded Not tainted 5.13.0-1007-oem #7-Ubuntu
> [  192.924071] Hardware name: innotek GmbH VirtualBox/VirtualBox, BIOS VirtualBox 12/01/2006
> [  192.924072] RIP: 0010:kfence_protect_page+0x33/0xc0
> [  192.924075] Code: 53 89 f3 48 8d 75 e4 48 83 ec 10 65 48 8b 04 25 28 00 00 00 48 89 45 e8 31 c0 e8 98 1f da ff 48 85 c0 74 06 83 7d e4 01 74 06 <0f> 0b 31 c0 eb 39 48 8b 38 48 89 c2 84 db 75 47 48 89 f8 0f 1f 40
> [  192.924077] RSP: 0018:ffff980c0077f918 EFLAGS: 00010046
> [  192.924079] RAX: 0000000000000000 RBX: 0000000000000000 RCX: ffffffffbcc10000
> [  192.924080] RDX: ffff980c0077f91c RSI: 0000000000032000 RDI: 0000000000000000
> [  192.924082] RBP: ffff980c0077f938 R08: 0000000000000000 R09: 0000000000000000
> [  192.924083] R10: 0000000000000000 R11: 0000000000000000 R12: 0000000000032000
> [  192.924084] R13: 0000000000000000 R14: ffff980c0077fb58 R15: 0000000000000000
> [  192.924085] FS:  00007f2491207540(0000) GS:ffff8ccb5bd00000(0000) knlGS:0000000000000000
> [  192.924087] CS:  0010 DS: 0000 ES: 0000 CR0: 0000000080050033
> [  192.924088] CR2: 00000000000325f8 CR3: 0000000102572005 CR4: 00000000000706e0
> [  192.924091] DR0: 0000000000000000 DR1: 0000000000000000 DR2: 0000000000000000
> [  192.924092] DR3: 0000000000000000 DR6: 00000000fffe0ff0 DR7: 0000000000000400
> [  192.924093] Call Trace:
> [  192.924096]  kfence_unprotect+0x17/0x30
> [  192.924099]  kfence_handle_page_fault+0x97/0x250
> [  192.924102]  ? cmp_ex_sort+0x30/0x30
> [  192.924104]  page_fault_oops+0xa0/0x2a0
> [  192.924106]  ? trace_event_buffer_reserve+0x22/0xb0
> [  192.924110]  ? search_exception_tables+0x5b/0x60
> [  192.924113]  kernelmode_fixup_or_oops+0x92/0xf0
> [  192.924115]  __bad_area_nosemaphore+0x14d/0x190
> [  192.924116]  __bad_area+0x5f/0x80
> [  192.924118]  bad_area+0x16/0x20
> [  192.924119]  do_user_addr_fault+0x368/0x640> [  192.924121]  ? aa_file_perm+0x11d/0x470
> [  192.924123]  exc_page_fault+0x7d/0x170
> [  192.924127]  asm_exc_page_fault+0x1e/0x30
> [  192.924129] RIP: 0010:trace_event_buffer_reserve+0x22/0xb0
> [  192.924132] Code: 00 00 00 00 0f 1f 40 00 55 48 89 e5 41 56 41 55 49 89 d5 41 54 49 89 f4 53 48 89 fb 4c 8b 76 10 f6 46 49 02 74 29 48 8b 46 28 <48> 8b 88 b8 00 00 00 48 8b 90 c0 00 00 00 48 09 d1 74 12 48 8b 40
> [  192.924134] RSP: 0018:ffff980c0077fc00 EFLAGS: 00010002
> [  192.924135] RAX: 0000000000032540 RBX: ffff980c0077fc38 RCX: 0000000000000002
> [  192.924136] RDX: 0000000000000028 RSI: ffffffffbcdb7e80 RDI: ffff980c0077fc38
> [  192.924137] RBP: ffff980c0077fc20 R08: ffff8ccb46814cb8 R09: 0000000000000010
> [  192.924138] R10: 000000007ffff000 R11: 0000000000000000 R12: ffffffffbcdb7e80
> [  192.924140] R13: 0000000000000028 R14: 0000000000000000 R15: ffff8ccb49b6ed0c
> [  192.924142]  trace_event_raw_event_sched_wakeup_template+0x63/0xf0
> [  192.924146]  try_to_wake_up+0x285/0x570
> [  192.924148]  wake_up_process+0x15/0x20
> [  192.924149]  io_wqe_activate_free_worker+0x5b/0x70
> [  192.924152]  io_wqe_enqueue+0xfb/0x190
> [  192.924154]  io_wq_enqueue+0x1e/0x20
> [  192.924156]  io_queue_async_work+0xa0/0x120
> [  192.924158]  __io_queue_sqe+0x17e/0x360
> [  192.924160]  ? io_req_free_batch_finish+0x8d/0xf0
> [  192.924162]  io_queue_sqe+0x199/0x2a0
> [  192.924164]  io_submit_sqes+0x70d/0x7f0
> [  192.924166]  __x64_sys_io_uring_enter+0x1b8/0x3d0
> [  192.924168]  do_syscall_64+0x40/0xb0
> [  192.924170]  entry_SYSCALL_64_after_hwframe+0x44/0xae
> [  192.924172] RIP: 0033:0x7f249112f89d
> [  192.924174] Code: 00 c3 66 2e 0f 1f 84 00 00 00 00 00 90 f3 0f 1e fa 48 89 f8 48 89 f7 48 89 d6 48 89 ca 4d 89 c2 4d 89 c8 4c 8b 4c 24 08 0f 05 <48> 3d 01 f0 ff ff 73 01 c3 48 8b 0d c3 f5 0c 00 f7 d8 64 89 01 48
> [  192.924179] RSP: 002b:00007fff56c491c8 EFLAGS: 00000216 ORIG_RAX: 00000000000001aa
> [  192.924180] RAX: ffffffffffffffda RBX: 0000000000000000 RCX: 00007f249112f89d
> [  192.924182] RDX: 0000000000000000 RSI: 0000000000000001 RDI: 0000000000000005
> [  192.924182] RBP: 00007fff56c49200 R08: 0000000000000000 R09: 0000000000000008
> [  192.924183] R10: 0000000000000000 R11: 0000000000000216 R12: 0000000000000000
> [  192.924184] R13: 00007fff56c49380 R14: 0000000000000dcf R15: 000055c533b6f2a0
> [  192.924186] ---[ end trace d1211902aae73d20 ]---

The problem seems to happen in this line of trace_event_ignore_this_pid():

pid_list = rcu_dereference_raw(tr->filtered_pids);

It seems it got inlined within trace_event_buffer_reserve()

There strangest things I found so far is this:

crash> sym global_trace
ffffffffbcdb7e80 (d) global_trace
crash> list ftrace_trace_arrays
ffffffffbcdb7e70
ffffffffbcdb7e80

trace_array has size 7672, but ffffffffbcdb7e70 is only 16 bytes away from
ffffffffbcdb7e80.

Also this:

crash> struct trace_array.events -o global_trace
struct trace_array {
  [ffffffffbcdb9be0] struct list_head events;
}
crash> list -s trace_event_file.tr -o trace_event_file.list ffffffffbcdb9be0
ffffffffbcdb9be0
  tr = 0xffffffffbcdb7b20
ffff8ccb45cdfb00
  tr = 0xffffffffbcdb7e80
ffff8ccb45cdf580
  tr = 0xffffffffbcdb7e80
ffff8ccb45cdfe18
  tr = 0xffffffffbcdb7e80
...
  tr = 0xffffffffbcdb7e80

The first one 0xffffffffbcdb7b20 is only 864 bytes away from 0xffffffffbcdb7e80

Additional information can be found here:
https://www.samba.org/~metze/202107221802.reproduce-freeze-05-first-time.v3-pid1/
-rw-r--r-- 1 metze metze 37250108 Jul 22 18:02 dump.202107221802
-rw-r--r-- 1 metze metze    63075 Jul 22 18:02 dmesg.202107221802
-rw-r--r-- 1 metze metze     8820 Jul 22 18:13 crash-bt-a-s.txt
-rw-r--r-- 1 metze metze    36586 Jul 22 18:14 crash-bt-a-l-FF-s.txt
-rw-r--r-- 1 metze metze     4798 Jul 22 23:49 crash-bt-p.txt
-rw-r--r-- 1 metze metze      946 Jul 23 00:13 strange-things.txt
-rw-r--r-- 1 metze metze      482 Jul 23 00:24 code-and-vmlinux.txt

The code can be found here:
https://kernel.ubuntu.com/git/kernel-ppa/mirror/ubuntu-oem-5.10-focal.git/tag/?h=Ubuntu-oem-5.13-5.13.0-1007.7

And the /usr/lib/debug/boot/vmlinux-5.13.0-1007-oem file can be extracted from here:
http://ddebs.ubuntu.com/pool/main/l/linux-oem-5.13/linux-image-unsigned-5.13.0-1007-oem-dbgsym_5.13.0-1007.7_amd64.ddeb

Also also needed the latest code from https://github.com/crash-utility/crash.git
(at commit f53b73e8380bca054cebd2b61ff118c46609429b)

It would be really great if you (or anyone else on the lists) could have a closer look
in order to get the problem fixed :-)

I've learned a lot this week and tried hard to find the problem myself,
but I have to move back to other work for now.

Thanks!
metze


[-- Attachment #2: OpenPGP digital signature --]
[-- Type: application/pgp-signature, Size: 833 bytes --]

^ permalink raw reply	[flat|nested] 17+ messages in thread
* Re: sched_waking vs. set_event_pid crash (Re: Tracing busy processes/threads freezes/stalls the whole machine)
  2021-07-22 22:43             ` sched_waking vs. set_event_pid crash (Re: Tracing busy processes/threads freezes/stalls the whole machine) Stefan Metzmacher
@ 2021-07-23  1:41               ` Steven Rostedt
  2021-07-23  2:51               ` Steven Rostedt
  1 sibling, 0 replies; 17+ messages in thread
From: Steven Rostedt @ 2021-07-23  1:41 UTC (permalink / raw)
  To: Stefan Metzmacher; +Cc: Ingo Molnar, linux-trace-devel, io-uring, linux-kernel

On Fri, 23 Jul 2021 00:43:13 +0200
Stefan Metzmacher <metze@samba.org> wrote:

> Hi Steve,

Hi Stefan,

>
> After some days of training:
> https://training.linuxfoundation.org/training/linux-kernel-debugging-and-security/
> I was able to get much closer to the problem :-)
>
> In order to reproduce it and get reliable kexec crash dumps,
> I needed to give the VM at least 3 cores.
>
> While running './io-uring_cp-forever link-cp.c file' (from:
> https://github.com/metze-samba/liburing/commits/io_uring-cp-forever )
> in one window, the following simple sequence triggered the problem in most cases:
>
> echo 1 > /sys/kernel/tracing/events/sched/sched_waking/enable
> echo 1 > /sys/kernel/tracing/set_event_pid

I was able to reproduce it with running hackbench in a while loop and
in another terminal, executing the above two lines.

I think I found the bug. Can you test this patch?

Thanks,

-- Steve

diff --git a/kernel/tracepoint.c b/kernel/tracepoint.c
index 976bf8ce8039..fc32821f8240 100644
--- a/kernel/tracepoint.c
+++ b/kernel/tracepoint.c
@@ -299,8 +299,8 @@ static int tracepoint_add_func(struct tracepoint *tp,
 	 * a pointer to it.  This array is referenced by __DO_TRACE from
 	 * include/linux/tracepoint.h using rcu_dereference_sched().
 	 */
-	rcu_assign_pointer(tp->funcs, tp_funcs);
 	tracepoint_update_call(tp, tp_funcs, false);
+	rcu_assign_pointer(tp->funcs, tp_funcs);
 	static_key_enable(&tp->key);

 	release_probes(old);

^ permalink raw reply related	[flat|nested] 17+ messages in thread
* Re: sched_waking vs. set_event_pid crash (Re: Tracing busy processes/threads freezes/stalls the whole machine)
  2021-07-22 22:43             ` sched_waking vs. set_event_pid crash (Re: Tracing busy processes/threads freezes/stalls the whole machine) Stefan Metzmacher
  2021-07-23  1:41               ` Steven Rostedt
@ 2021-07-23  2:51               ` Steven Rostedt
  2021-07-23 10:35                 ` Stefan Metzmacher
  1 sibling, 1 reply; 17+ messages in thread
From: Steven Rostedt @ 2021-07-23  2:51 UTC (permalink / raw)
  To: Stefan Metzmacher; +Cc: Ingo Molnar, linux-trace-devel, io-uring, linux-kernel

On Fri, 23 Jul 2021 00:43:13 +0200
Stefan Metzmacher <metze@samba.org> wrote:

> Hi Steve,
>
> After some days of training:
> https://training.linuxfoundation.org/training/linux-kernel-debugging-and-security/
> I was able to get much closer to the problem :-)

Well, knowing what to look for was not going to be easy. And I'm sure
you were shocked to see what I posted as a fix ;-)

Assuming this does fix your issue, I sent out a real patch with the
explanation of what happened in the change log, so that you can see why
that change was your issue.

>
> In order to reproduce it and get reliable kexec crash dumps,
> I needed to give the VM at least 3 cores.

Yes, it did require having this run on multiple CPUs to have a race
condition trigger, and two cores would have been hard to hit it. I ran
it on 8 cores and it triggered rather easily.

>
> While running './io-uring_cp-forever link-cp.c file' (from:
> https://github.com/metze-samba/liburing/commits/io_uring-cp-forever )
> in one window, the following simple sequence triggered the problem in most cases:
>
> echo 1 > /sys/kernel/tracing/events/sched/sched_waking/enable
> echo 1 > /sys/kernel/tracing/set_event_pid

All it took was something busy that did a lot of wakeups while setting
the set_event_pid, to be able to hit the race easily. As I stated, I
triggered it with running hackbench instead of the io-uring code. In
fact, this bug had nothing to do with io-uring, and you were only
triggering it because you were making enough of a load on the system to
make the race happen often.

>
> It triggered the following:
>
> > [  192.924023] ------------[ cut here ]------------
> > [  192.924026] WARNING: CPU: 2 PID: 1696 at arch/x86/include/asm/kfence.h:44 kfence_protect_page+0x33/0xc0
> > [  192.924034] Modules linked in: vboxsf intel_rapl_msr intel_rapl_common crct10dif_pclmul ghash_clmulni_intel aesni_intel crypto_simd cryptd rapl vboxvideo drm_vr
> > am_helper drm_ttm_helper ttm snd_intel8x0 input_leds snd_ac97_codec joydev ac97_bus serio_raw snd_pcm drm_kms_helper cec mac_hid vboxguest snd_timer rc_core snd fb
> > _sys_fops syscopyarea sysfillrect soundcore sysimgblt kvm_intel kvm sch_fq_codel drm sunrpc ip_tables x_tables autofs4 hid_generic usbhid hid crc32_pclmul psmouse
> > ahci libahci e1000 i2c_piix4 pata_acpi video
> > [  192.924068] CPU: 2 PID: 1696 Comm: io_uring-cp-for Kdump: loaded Not tainted 5.13.0-1007-oem #7-Ubuntu
> > [  192.924071] Hardware name: innotek GmbH VirtualBox/VirtualBox, BIOS VirtualBox 12/01/2006
> > [  192.924072] RIP: 0010:kfence_protect_page+0x33/0xc0
> > [  192.924075] Code: 53 89 f3 48 8d 75 e4 48 83 ec 10 65 48 8b 04 25 28 00 00 00 48 89 45 e8 31 c0 e8 98 1f da ff 48 85 c0 74 06 83 7d e4 01 74 06 <0f> 0b 31 c0 eb 39 48 8b 38 48 89 c2 84 db 75 47 48 89 f8 0f 1f 40
> > [  192.924077] RSP: 0018:ffff980c0077f918 EFLAGS: 00010046
> > [  192.924079] RAX: 0000000000000000 RBX: 0000000000000000 RCX: ffffffffbcc10000
> > [  192.924080] RDX: ffff980c0077f91c RSI: 0000000000032000 RDI: 0000000000000000
> > [  192.924082] RBP: ffff980c0077f938 R08: 0000000000000000 R09: 0000000000000000
> > [  192.924083] R10: 0000000000000000 R11: 0000000000000000 R12: 0000000000032000
> > [  192.924084] R13: 0000000000000000 R14: ffff980c0077fb58 R15: 0000000000000000
> > [  192.924085] FS:  00007f2491207540(0000) GS:ffff8ccb5bd00000(0000) knlGS:0000000000000000
> > [  192.924087] CS:  0010 DS: 0000 ES: 0000 CR0: 0000000080050033
> > [  192.924088] CR2: 00000000000325f8 CR3: 0000000102572005 CR4: 00000000000706e0
> > [  192.924091] DR0: 0000000000000000 DR1: 0000000000000000 DR2: 0000000000000000
> > [  192.924092] DR3: 0000000000000000 DR6: 00000000fffe0ff0 DR7: 0000000000000400
> > [  192.924093] Call Trace:
> > [  192.924096]  kfence_unprotect+0x17/0x30
> > [  192.924099]  kfence_handle_page_fault+0x97/0x250
> > [  192.924102]  ? cmp_ex_sort+0x30/0x30
> > [  192.924104]  page_fault_oops+0xa0/0x2a0
> > [  192.924106]  ? trace_event_buffer_reserve+0x22/0xb0
> > [  192.924110]  ? search_exception_tables+0x5b/0x60
> > [  192.924113]  kernelmode_fixup_or_oops+0x92/0xf0
> > [  192.924115]  __bad_area_nosemaphore+0x14d/0x190
> > [  192.924116]  __bad_area+0x5f/0x80
> > [  192.924118]  bad_area+0x16/0x20
> > [  192.924119]  do_user_addr_fault+0x368/0x640> [  192.924121]  ? aa_file_perm+0x11d/0x470
> > [  192.924123]  exc_page_fault+0x7d/0x170
> > [  192.924127]  asm_exc_page_fault+0x1e/0x30
> > [  192.924129] RIP: 0010:trace_event_buffer_reserve+0x22/0xb0
> > [  192.924132] Code: 00 00 00 00 0f 1f 40 00 55 48 89 e5 41 56 41 55 49 89 d5 41 54 49 89 f4 53 48 89 fb 4c 8b 76 10 f6 46 49 02 74 29 48 8b 46 28 <48> 8b 88 b8 00 00 00 48 8b 90 c0 00 00 00 48 09 d1 74 12 48 8b 40
> > [  192.924134] RSP: 0018:ffff980c0077fc00 EFLAGS: 00010002
> > [  192.924135] RAX: 0000000000032540 RBX: ffff980c0077fc38 RCX: 0000000000000002
> > [  192.924136] RDX: 0000000000000028 RSI: ffffffffbcdb7e80 RDI: ffff980c0077fc38
> > [  192.924137] RBP: ffff980c0077fc20 R08: ffff8ccb46814cb8 R09: 0000000000000010
> > [  192.924138] R10: 000000007ffff000 R11: 0000000000000000 R12: ffffffffbcdb7e80
> > [  192.924140] R13: 0000000000000028 R14: 0000000000000000 R15: ffff8ccb49b6ed0c
> > [  192.924142]  trace_event_raw_event_sched_wakeup_template+0x63/0xf0
> > [  192.924146]  try_to_wake_up+0x285/0x570
> > [  192.924148]  wake_up_process+0x15/0x20
> > [  192.924149]  io_wqe_activate_free_worker+0x5b/0x70
> > [  192.924152]  io_wqe_enqueue+0xfb/0x190
> > [  192.924154]  io_wq_enqueue+0x1e/0x20
> > [  192.924156]  io_queue_async_work+0xa0/0x120
> > [  192.924158]  __io_queue_sqe+0x17e/0x360
> > [  192.924160]  ? io_req_free_batch_finish+0x8d/0xf0
> > [  192.924162]  io_queue_sqe+0x199/0x2a0
> > [  192.924164]  io_submit_sqes+0x70d/0x7f0
> > [  192.924166]  __x64_sys_io_uring_enter+0x1b8/0x3d0
> > [  192.924168]  do_syscall_64+0x40/0xb0
> > [  192.924170]  entry_SYSCALL_64_after_hwframe+0x44/0xae
> > [  192.924172] RIP: 0033:0x7f249112f89d
> > [  192.924174] Code: 00 c3 66 2e 0f 1f 84 00 00 00 00 00 90 f3 0f 1e fa 48 89 f8 48 89 f7 48 89 d6 48 89 ca 4d 89 c2 4d 89 c8 4c 8b 4c 24 08 0f 05 <48> 3d 01 f0 ff ff 73 01 c3 48 8b 0d c3 f5 0c 00 f7 d8 64 89 01 48
> > [  192.924179] RSP: 002b:00007fff56c491c8 EFLAGS: 00000216 ORIG_RAX: 00000000000001aa
> > [  192.924180] RAX: ffffffffffffffda RBX: 0000000000000000 RCX: 00007f249112f89d
> > [  192.924182] RDX: 0000000000000000 RSI: 0000000000000001 RDI: 0000000000000005
> > [  192.924182] RBP: 00007fff56c49200 R08: 0000000000000000 R09: 0000000000000008
> > [  192.924183] R10: 0000000000000000 R11: 0000000000000216 R12: 0000000000000000
> > [  192.924184] R13: 00007fff56c49380 R14: 0000000000000dcf R15: 000055c533b6f2a0
> > [  192.924186] ---[ end trace d1211902aae73d20 ]---
>
> The problem seems to happen in this line of trace_event_ignore_this_pid():
>
> pid_list = rcu_dereference_raw(tr->filtered_pids);

That "tr" comes from the trace_event_file that is passed in by the
"data" field of the callback. Hence, this callback got the data field
of the event_filter_pid_sched_wakeup_probe_pre() callback that is
called before all events when the set_event_pid file is set. That
means, the "tr" being dereferened was not the "tr" you were looking for.

>
> It seems it got inlined within trace_event_buffer_reserve()
>
> There strangest things I found so far is this:
>
> crash> sym global_trace
> ffffffffbcdb7e80 (d) global_trace
> crash> list ftrace_trace_arrays
> ffffffffbcdb7e70
> ffffffffbcdb7e80
>
> trace_array has size 7672, but ffffffffbcdb7e70 is only 16 bytes away from
> ffffffffbcdb7e80.

ftrace_trace_arrays is a list_head, and I doubt you created any
instances, thus the list head has only one instance, and that is
global_trace. Hence, it points to global_trace and itself. It just so
happens that a list_head is 16 bytes.


>
> Also this:
>
> crash> struct trace_array.events -o global_trace
> struct trace_array {
>   [ffffffffbcdb9be0] struct list_head events;
> }
> crash> list -s trace_event_file.tr -o trace_event_file.list ffffffffbcdb9be0
> ffffffffbcdb9be0
>   tr = 0xffffffffbcdb7b20
> ffff8ccb45cdfb00
>   tr = 0xffffffffbcdb7e80
> ffff8ccb45cdf580
>   tr = 0xffffffffbcdb7e80
> ffff8ccb45cdfe18
>   tr = 0xffffffffbcdb7e80
> ...
>   tr = 0xffffffffbcdb7e80
>
> The first one 0xffffffffbcdb7b20 is only 864 bytes away from 0xffffffffbcdb7e80

I'm thinking it is confused by hitting the ftrace_trace_arrays
list_head itself.

>
> Additional information can be found here:
> https://www.samba.org/~metze/202107221802.reproduce-freeze-05-first-time.v3-pid1/
> -rw-r--r-- 1 metze metze 37250108 Jul 22 18:02 dump.202107221802
> -rw-r--r-- 1 metze metze    63075 Jul 22 18:02 dmesg.202107221802
> -rw-r--r-- 1 metze metze     8820 Jul 22 18:13 crash-bt-a-s.txt
> -rw-r--r-- 1 metze metze    36586 Jul 22 18:14 crash-bt-a-l-FF-s.txt
> -rw-r--r-- 1 metze metze     4798 Jul 22 23:49 crash-bt-p.txt
> -rw-r--r-- 1 metze metze      946 Jul 23 00:13 strange-things.txt
> -rw-r--r-- 1 metze metze      482 Jul 23 00:24 code-and-vmlinux.txt
>
> The code can be found here:
> https://kernel.ubuntu.com/git/kernel-ppa/mirror/ubuntu-oem-5.10-focal.git/tag/?h=Ubuntu-oem-5.13-5.13.0-1007.7
>
> And the /usr/lib/debug/boot/vmlinux-5.13.0-1007-oem file can be extracted from here:
> http://ddebs.ubuntu.com/pool/main/l/linux-oem-5.13/linux-image-unsigned-5.13.0-1007-oem-dbgsym_5.13.0-1007.7_amd64.ddeb
>
> Also also needed the latest code from https://github.com/crash-utility/crash.git
> (at commit f53b73e8380bca054cebd2b61ff118c46609429b)
>
> It would be really great if you (or anyone else on the lists) could have a closer look
> in order to get the problem fixed :-)

Once I triggered it and started looking at what was happening, it
didn't take me to long to figure out where the culprit was.

>
> I've learned a lot this week and tried hard to find the problem myself,
> but I have to move back to other work for now.
>

I'm glad you learned a lot. There's a lot of complex code in there, and
its getting more complex, as you can see with the static_calls.

This is because tracing tries hard to avoid the heisenbug effect. You
know, you see a bug, turn on tracing, and then that bug goes away!

Thus it pulls out all the tricks it can to be as least intrusive on the
system as it can be. And that causes things to get complex really quick.

Cheers, and thanks for keeping up on this bug!

-- Steve

^ permalink raw reply	[flat|nested] 17+ messages in thread
* Re: sched_waking vs. set_event_pid crash (Re: Tracing busy processes/threads freezes/stalls the whole machine)
  2021-07-23  2:51               ` Steven Rostedt
@ 2021-07-23 10:35                 ` Stefan Metzmacher
  2021-07-23 11:29                   ` Steven Rostedt
  0 siblings, 1 reply; 17+ messages in thread
From: Stefan Metzmacher @ 2021-07-23 10:35 UTC (permalink / raw)
  To: Steven Rostedt; +Cc: Ingo Molnar, linux-trace-devel, io-uring, linux-kernel


[-- Attachment #1.1: Type: text/plain, Size: 5748 bytes --]


Hi Steve,
>> After some days of training:
>> https://training.linuxfoundation.org/training/linux-kernel-debugging-and-security/
>> I was able to get much closer to the problem :-)
>
> Well, knowing what to look for was not going to be easy.
>
> And I'm sure you were shocked to see what I posted as a fix ;-)

Not really, such problems typically just have one line fixes :-)

> Assuming this does fix your issue, I sent out a real patch with the
> explanation of what happened in the change log, so that you can see why
> that change was your issue.

Yes, it does the trick, thanks very much!

>> In order to reproduce it and get reliable kexec crash dumps,
>> I needed to give the VM at least 3 cores.
>
> Yes, it did require having this run on multiple CPUs to have a race
> condition trigger, and two cores would have been hard to hit it. I ran
> it on 8 cores and it triggered rather easily.

I mean I was able to trigger the problem with 2 cores, but then
the machine was completely stuck, without triggering the kexec reboot
to get the crash dump. I don't understand why as the additional cpu
is not really involved at all..

Any idea why kexec could be so unreliable?
(even with 3 or 6 cpus it sometimes just didn't trigger)

>> While running './io-uring_cp-forever link-cp.c file' (from:
>> https://github.com/metze-samba/liburing/commits/io_uring-cp-forever )
>> in one window, the following simple sequence triggered the problem in most cases:
>>
>> echo 1 > /sys/kernel/tracing/events/sched/sched_waking/enable
>> echo 1 > /sys/kernel/tracing/set_event_pid
>
> All it took was something busy that did a lot of wakeups while setting
> the set_event_pid, to be able to hit the race easily. As I stated, I
> triggered it with running hackbench instead of the io-uring code. In
> fact, this bug had nothing to do with io-uring, and you were only
> triggering it because you were making enough of a load on the system to
> make the race happen often.

Yes, it was just the example that made it most reliable to trigger for me.

>> pid_list = rcu_dereference_raw(tr->filtered_pids);
>
> That "tr" comes from the trace_event_file that is passed in by the
> "data" field of the callback. Hence, this callback got the data field
> of the event_filter_pid_sched_wakeup_probe_pre() callback that is
> called before all events when the set_event_pid file is set. That
> means, the "tr" being dereferened was not the "tr" you were looking for.

Yes, that's what I assumed, but didn't find the reason for.

>>
>> It seems it got inlined within trace_event_buffer_reserve()
>>
>> There strangest things I found so far is this:
>>
>> crash> sym global_trace
>> ffffffffbcdb7e80 (d) global_trace
>> crash> list ftrace_trace_arrays
>> ffffffffbcdb7e70
>> ffffffffbcdb7e80
>>
>> trace_array has size 7672, but ffffffffbcdb7e70 is only 16 bytes away from
>> ffffffffbcdb7e80.
>
> ftrace_trace_arrays is a list_head, and I doubt you created any
> instances, thus the list head has only one instance, and that is
> global_trace. Hence, it points to global_trace and itself. It just so
> happens that a list_head is 16 bytes.

Ah, that explains a lot:

crash> struct list_head -o ftrace_trace_arrays
struct list_head {
  [ffffffffbcdb7e70] struct list_head *next;
  [ffffffffbcdb7e78] struct list_head *prev;
}
SIZE: 16
crash> list  ftrace_trace_arrays
ffffffffbcdb7e70
ffffffffbcdb7e80

I guess this is what I want:

crash> list -H ftrace_trace_arrays
ffffffffbcdb7e80

>> Also this:
>>
>> crash> struct trace_array.events -o global_trace
>> struct trace_array {
>>   [ffffffffbcdb9be0] struct list_head events;
>> }
>> crash> list -s trace_event_file.tr -o trace_event_file.list ffffffffbcdb9be0
>> ffffffffbcdb9be0
>>   tr = 0xffffffffbcdb7b20
>> ffff8ccb45cdfb00
>>   tr = 0xffffffffbcdb7e80
>> ffff8ccb45cdf580
>>   tr = 0xffffffffbcdb7e80
>> ffff8ccb45cdfe18
>>   tr = 0xffffffffbcdb7e80
>> ...
>>   tr = 0xffffffffbcdb7e80
>>
>> The first one 0xffffffffbcdb7b20 is only 864 bytes away from 0xffffffffbcdb7e80
>
> I'm thinking it is confused by hitting the ftrace_trace_arrays
> list_head itself.

Yes, I needed the -H here too:

list -s trace_event_file.tr -o trace_event_file.list -H ffffffffbcdb9be0


>> It would be really great if you (or anyone else on the lists) could have a closer look
>> in order to get the problem fixed :-)
>
> Once I triggered it and started looking at what was happening, it
> didn't take me to long to figure out where the culprit was.

Great!

>>
>> I've learned a lot this week and tried hard to find the problem myself,
>> but I have to move back to other work for now.
>>
>
> I'm glad you learned a lot. There's a lot of complex code in there, and
> its getting more complex, as you can see with the static_calls.
>
> This is because tracing tries hard to avoid the heisenbug effect. You
> know, you see a bug, turn on tracing, and then that bug goes away!
>
> Thus it pulls out all the tricks it can to be as least intrusive on the
> system as it can be. And that causes things to get complex really quick.

I'll have a look, I may need something similar for my smbdirect socket driver
in future.

> Cheers, and thanks for keeping up on this bug!

Thanks for fixing the bug!

Now I can finally use:

trace-cmd record -e all -P $(pidof io_uring-cp-forever)

But that doesn't include the iou-wrk-* threads
and the '-c' option seems to only work with forking.

Is there a way to specify "trace *all* threads of the given pid"?
(Note the threads are comming and going, so it's not possible to
specifiy -P more than once)

Thanks!
metze


[-- Attachment #2: OpenPGP digital signature --]
[-- Type: application/pgp-signature, Size: 833 bytes --]

^ permalink raw reply	[flat|nested] 17+ messages in thread
* Re: sched_waking vs. set_event_pid crash (Re: Tracing busy processes/threads freezes/stalls the whole machine)
  2021-07-23 10:35                 ` Stefan Metzmacher
@ 2021-07-23 11:29                   ` Steven Rostedt
  2021-07-23 11:53                     ` Stefan Metzmacher
  0 siblings, 1 reply; 17+ messages in thread
From: Steven Rostedt @ 2021-07-23 11:29 UTC (permalink / raw)
  To: Stefan Metzmacher; +Cc: Ingo Molnar, linux-trace-devel, io-uring, linux-kernel

On Fri, 23 Jul 2021 12:35:09 +0200
Stefan Metzmacher <metze@samba.org> wrote:

> > Assuming this does fix your issue, I sent out a real patch with the
> > explanation of what happened in the change log, so that you can see why
> > that change was your issue.
>
> Yes, it does the trick, thanks very much!

Can I get a "Tested-by" from you?

> Now I can finally use:
>
> trace-cmd record -e all -P $(pidof io_uring-cp-forever)
>
> But that doesn't include the iou-wrk-* threads
> and the '-c' option seems to only work with forking.

Have you tried it? It should work for threads as well. It hooks to the
sched_process_fork tracepoint, which should be triggered even when a new
thread is created.

Or do you mean that you want that process and all its threads too that are
already running? I could probably have it try to add it via the /proc file
system in that case.

Can you start the task via trace-cmd?

  trace-cmd record -e all -F -c io_uring-cp-forever ...


>
> Is there a way to specify "trace *all* threads of the given pid"?
> (Note the threads are comming and going, so it's not possible to
> specifiy -P more than once)

Right, although, you could append tasks manually to the set_event_pid file
from another terminal after starting trace-cmd. Once a pid is added to that
file, all children it makes will also be added. That could be a work around
until we have trace-cmd do it.

Care to write a bugzilla report for this feature?

  https://bugzilla.kernel.org/buglist.cgi?component=Trace-cmd%2FKernelshark&list_id=1088173

-- Steve

^ permalink raw reply	[flat|nested] 17+ messages in thread
* Re: sched_waking vs. set_event_pid crash (Re: Tracing busy processes/threads freezes/stalls the whole machine)
  2021-07-23 11:29                   ` Steven Rostedt
@ 2021-07-23 11:53                     ` Stefan Metzmacher
  2021-07-23 12:41                       ` Steven Rostedt
  0 siblings, 1 reply; 17+ messages in thread
From: Stefan Metzmacher @ 2021-07-23 11:53 UTC (permalink / raw)
  To: Steven Rostedt; +Cc: Ingo Molnar, linux-trace-devel, io-uring, linux-kernel


[-- Attachment #1.1: Type: text/plain, Size: 2088 bytes --]


Hi Steve,

>>> Assuming this does fix your issue, I sent out a real patch with the
>>> explanation of what happened in the change log, so that you can see why
>>> that change was your issue.
>>
>> Yes, it does the trick, thanks very much!
>
> Can I get a "Tested-by" from you?

Sure!

Can you check if the static_key_disable() and static_key_enable()
calls are correctly ordered compared to rcu_assign_pointer()
and explain why they are, as I not really understand that it's different
from tracepoint_update_call vs. rcu_assign_pointer

>> Now I can finally use:
>>
>> trace-cmd record -e all -P $(pidof io_uring-cp-forever)
>>
>> But that doesn't include the iou-wrk-* threads
>> and the '-c' option seems to only work with forking.
>
> Have you tried it? It should work for threads as well. It hooks to the
> sched_process_fork tracepoint, which should be triggered even when a new
> thread is created.
>
> Or do you mean that you want that process and all its threads too that are
> already running? I could probably have it try to add it via the /proc file
> system in that case.
>
> Can you start the task via trace-cmd?
>
>   trace-cmd record -e all -F -c io_uring-cp-forever ...

I think that would work, but I typically want to analyze a process
that is already running.

>> Is there a way to specify "trace *all* threads of the given pid"?
>> (Note the threads are comming and going, so it's not possible to
>> specifiy -P more than once)
>
> Right, although, you could append tasks manually to the set_event_pid file
> from another terminal after starting trace-cmd. Once a pid is added to that
> file, all children it makes will also be added. That could be a work around
> until we have trace-cmd do it.

Sure, but it will always be racy.

With children, does new threads also count as children or only fork() children?

> Care to write a bugzilla report for this feature?
>
>   https://bugzilla.kernel.org/buglist.cgi?component=Trace-cmd%2FKernelshark&list_id=1088173

I may do later...

Thanks!
metze


[-- Attachment #2: OpenPGP digital signature --]
[-- Type: application/pgp-signature, Size: 833 bytes --]

^ permalink raw reply	[flat|nested] 17+ messages in thread
* Re: sched_waking vs. set_event_pid crash (Re: Tracing busy processes/threads freezes/stalls the whole machine)
  2021-07-23 11:53                     ` Stefan Metzmacher
@ 2021-07-23 12:41                       ` Steven Rostedt
  0 siblings, 0 replies; 17+ messages in thread
From: Steven Rostedt @ 2021-07-23 12:41 UTC (permalink / raw)
  To: Stefan Metzmacher; +Cc: Ingo Molnar, linux-trace-devel, io-uring, linux-kernel

On Fri, 23 Jul 2021 13:53:41 +0200
Stefan Metzmacher <metze@samba.org> wrote:

> Hi Steve,
>
> >>> Assuming this does fix your issue, I sent out a real patch with the
> >>> explanation of what happened in the change log, so that you can see why
> >>> that change was your issue.
> >>
> >> Yes, it does the trick, thanks very much!
> >
> > Can I get a "Tested-by" from you?
>
> Sure!

Thanks.

>
> Can you check if the static_key_disable() and static_key_enable()
> calls are correctly ordered compared to rcu_assign_pointer()
> and explain why they are, as I not really understand that it's different
> from tracepoint_update_call vs. rcu_assign_pointer

The order doesn't even matter. I'm assuming you are talking about the
static_key_disable/enable with respect to enabling the tracepoint.

The reason it doesn't matter is because the rcu_assign_pointer is
updating an array of elements that hold both the function to call and
the data it needs. Inside the tracepoint loop where the callbacks are
called, in the iterator code (not the static call), you will see:

		it_func_ptr =						\
			rcu_dereference_raw((&__tracepoint_##_name)->funcs); \
		if (it_func_ptr) {					\
			do {						\
				it_func = READ_ONCE((it_func_ptr)->func); \
				__data = (it_func_ptr)->data;		\
				((void(*)(void *, proto))(it_func))(__data, args); \
			} while ((++it_func_ptr)->func);		\
		}

What that does is to get either the old array, or the new array and
places that array into it_func_ptr. Each element of this array contains
the callback (in .func) and the callback's data (in .data).

The enabling or disabling of the tracepoint doesn't really make a
difference with respect to the order of updating the funcs array.
That's because the users of this will either see the old array, the new
array, or NULL, in that it_func_ptr. This is how RCU works.

The bug we hit was because the static_call was updated separately from
the array. That makes it more imperative that you get the order
correct. As my email stated, with static_calls we have this:

		it_func_ptr =						\
			rcu_dereference_raw((&__tracepoint_##name)->funcs); \
		if (it_func_ptr) {					\
			__data = (it_func_ptr)->data;			\
			static_call(tp_func_##name)(__data, args);	\
		}

Where the issue is that the static_call which chooses which callback to
make, is updated asynchronously from the update of the array.

>
> >> Now I can finally use:
> >>
> >> trace-cmd record -e all -P $(pidof io_uring-cp-forever)
> >>
> >> But that doesn't include the iou-wrk-* threads
> >> and the '-c' option seems to only work with forking.
> >
> > Have you tried it? It should work for threads as well. It hooks to the
> > sched_process_fork tracepoint, which should be triggered even when a new
> > thread is created.
> >
> > Or do you mean that you want that process and all its threads too that are
> > already running? I could probably have it try to add it via the /proc file
> > system in that case.
> >
> > Can you start the task via trace-cmd?
> >
> >   trace-cmd record -e all -F -c io_uring-cp-forever ...
>
> I think that would work, but I typically want to analyze a process
> that is already running.
>
> >> Is there a way to specify "trace *all* threads of the given pid"?
> >> (Note the threads are comming and going, so it's not possible to
> >> specifiy -P more than once)
> >
> > Right, although, you could append tasks manually to the set_event_pid file
> > from another terminal after starting trace-cmd. Once a pid is added to that
> > file, all children it makes will also be added. That could be a work around
> > until we have trace-cmd do it.
>
> Sure, but it will always be racy.

Not really. Matters what you mean by "racy". You wont be able to
"instantaneously" enable a process and all its threads, but you can
capture all of them after a given point. As you are attaching to a
process already running, you already missed events because you were not
yet tracing. But once you have a thread, you will always have it.

>
> With children, does new threads also count as children or only fork() children?

New threads. It's the kernel point of view of a task, which does not
differentiate processes from threads. Everything that can be scheduled
on a CPU is called a "task". How a task interacts with other tasks is
what defines it being a "thread" or a "process".

>
> > Care to write a bugzilla report for this feature?
> >
> >   https://bugzilla.kernel.org/buglist.cgi?component=Trace-cmd%2FKernelshark&list_id=1088173
>
> I may do later...
>

Thanks,

-- Steve

^ permalink raw reply	[flat|nested] 17+ messages in thread
end of thread, other threads:[~2021-07-23 12:41 UTC | newest]

Thread overview: 17+ messages (download: mbox.gz / follow: Atom feed)
-- links below jump to the message on this page --
2021-04-22 14:26 Tracing busy processes/threads freezes/stalls the whole machine Stefan Metzmacher
2021-04-22 14:55 ` Stefan Metzmacher
2021-05-04 12:26 ` Stefan Metzmacher
2021-05-04 13:24 ` Steven Rostedt
2021-05-04 13:28   ` Stefan Metzmacher
2021-05-04 13:32     ` Steven Rostedt
2021-05-04 13:35     ` Steven Rostedt
2021-05-05  9:50       ` Stefan Metzmacher
2021-05-31 15:39         ` Stefan Metzmacher
2021-07-19 17:07           ` Stefan Metzmacher
2021-07-22 22:43             ` sched_waking vs. set_event_pid crash (Re: Tracing busy processes/threads freezes/stalls the whole machine) Stefan Metzmacher
2021-07-23  1:41               ` Steven Rostedt
2021-07-23  2:51               ` Steven Rostedt
2021-07-23 10:35                 ` Stefan Metzmacher
2021-07-23 11:29                   ` Steven Rostedt
2021-07-23 11:53                     ` Stefan Metzmacher
2021-07-23 12:41                       ` Steven Rostedt
This is a public inbox, see mirroring instructions
for how to clone and mirror all data and code used for this inbox;
as well as URLs for NNTP newsgroup(s).